How to Use the “Compare Datasets” Module
The Compare Datasets module allows you to analyze two backtesting datasets to see:
-
How many trades overlap
-
Which trades match by entry and target prices
-
Who sent the trade first
-
The time delay between similar trades
This makes it easy to identify copied signals and understand portfolio risk exposure.
Why This Feature Is Useful
Not all signal providers generate original trades.
Some providers:
-
Copy trades from other channels
-
Forward trades with delays
-
Slightly reword messages to hide the source
Thanks to modern data analysis, this behavior is easy to detect.
By comparing datasets, you can:
-
See whether two providers are sending the same trades
-
Identify the original source vs. the follower
-
Measure how late copied trades arrive
-
Avoid stacking correlated risk in prop firm accounts
A late trade is often less valid than the original due to price movement — and copied trades can silently distort your overall risk.
Step 1: Open the Compare Datasets Module
-
Navigate to the Compare Datasets tab in the backtester
-
You’ll see two dropdown menus labeled for dataset selection
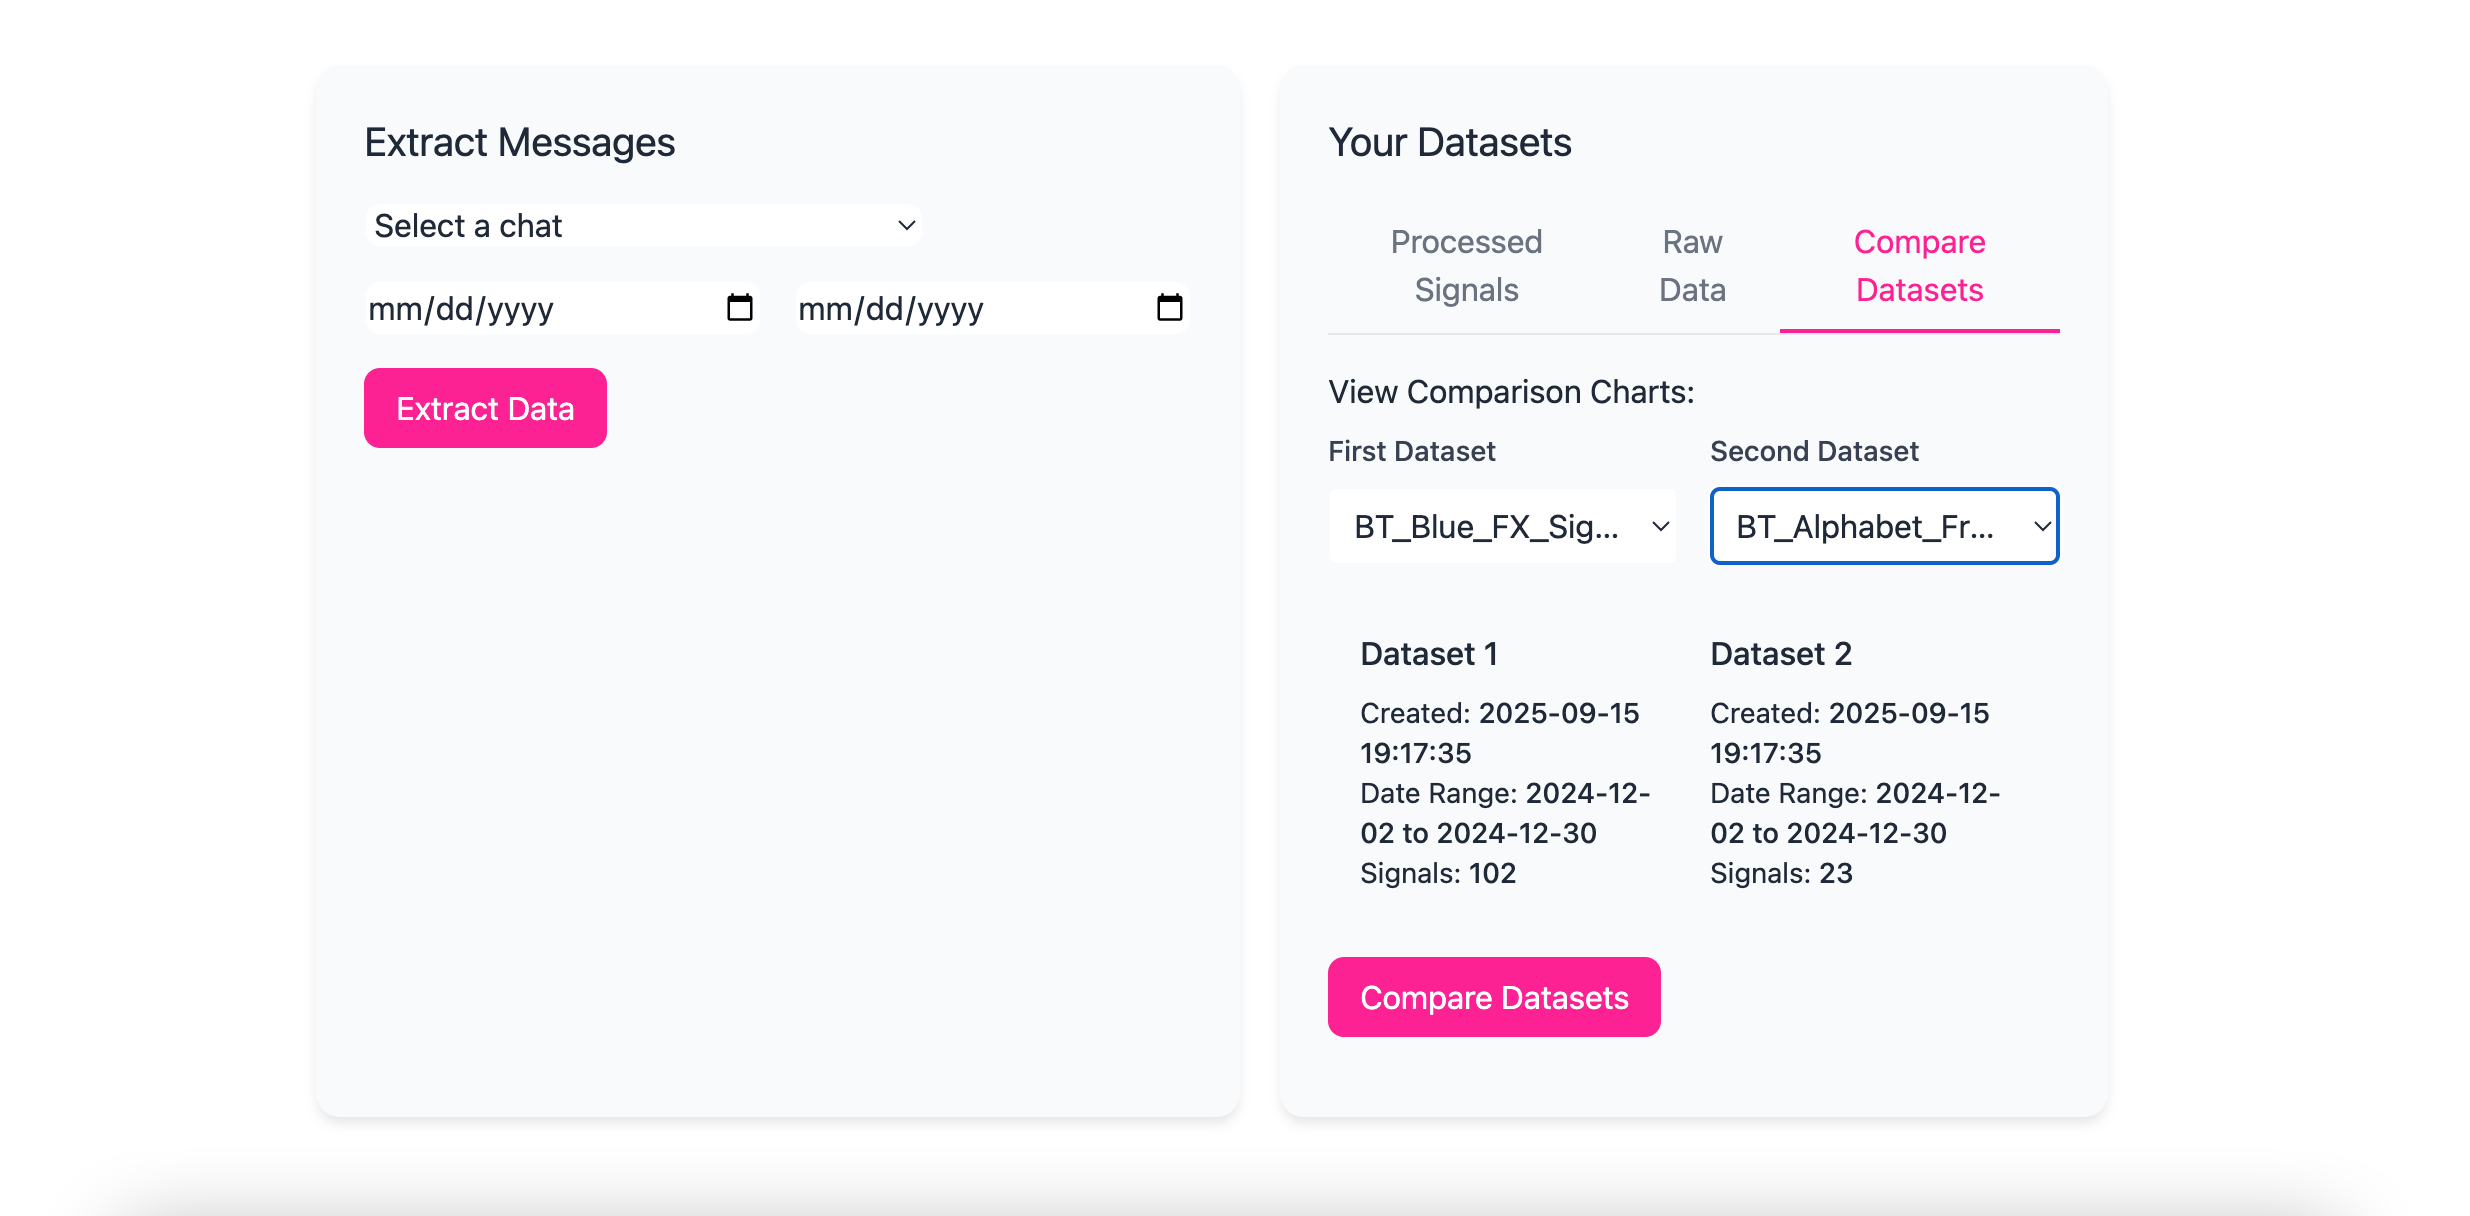
Step 2: Load the Datasets
-
Select the first dataset from the left dropdown
-
Select the second dataset from the right dropdown
-
Click Compare Datasets
The system will analyze both datasets automatically.
Step 3: Review the Comparison Report
Once the comparison is complete, you’ll see several sections:
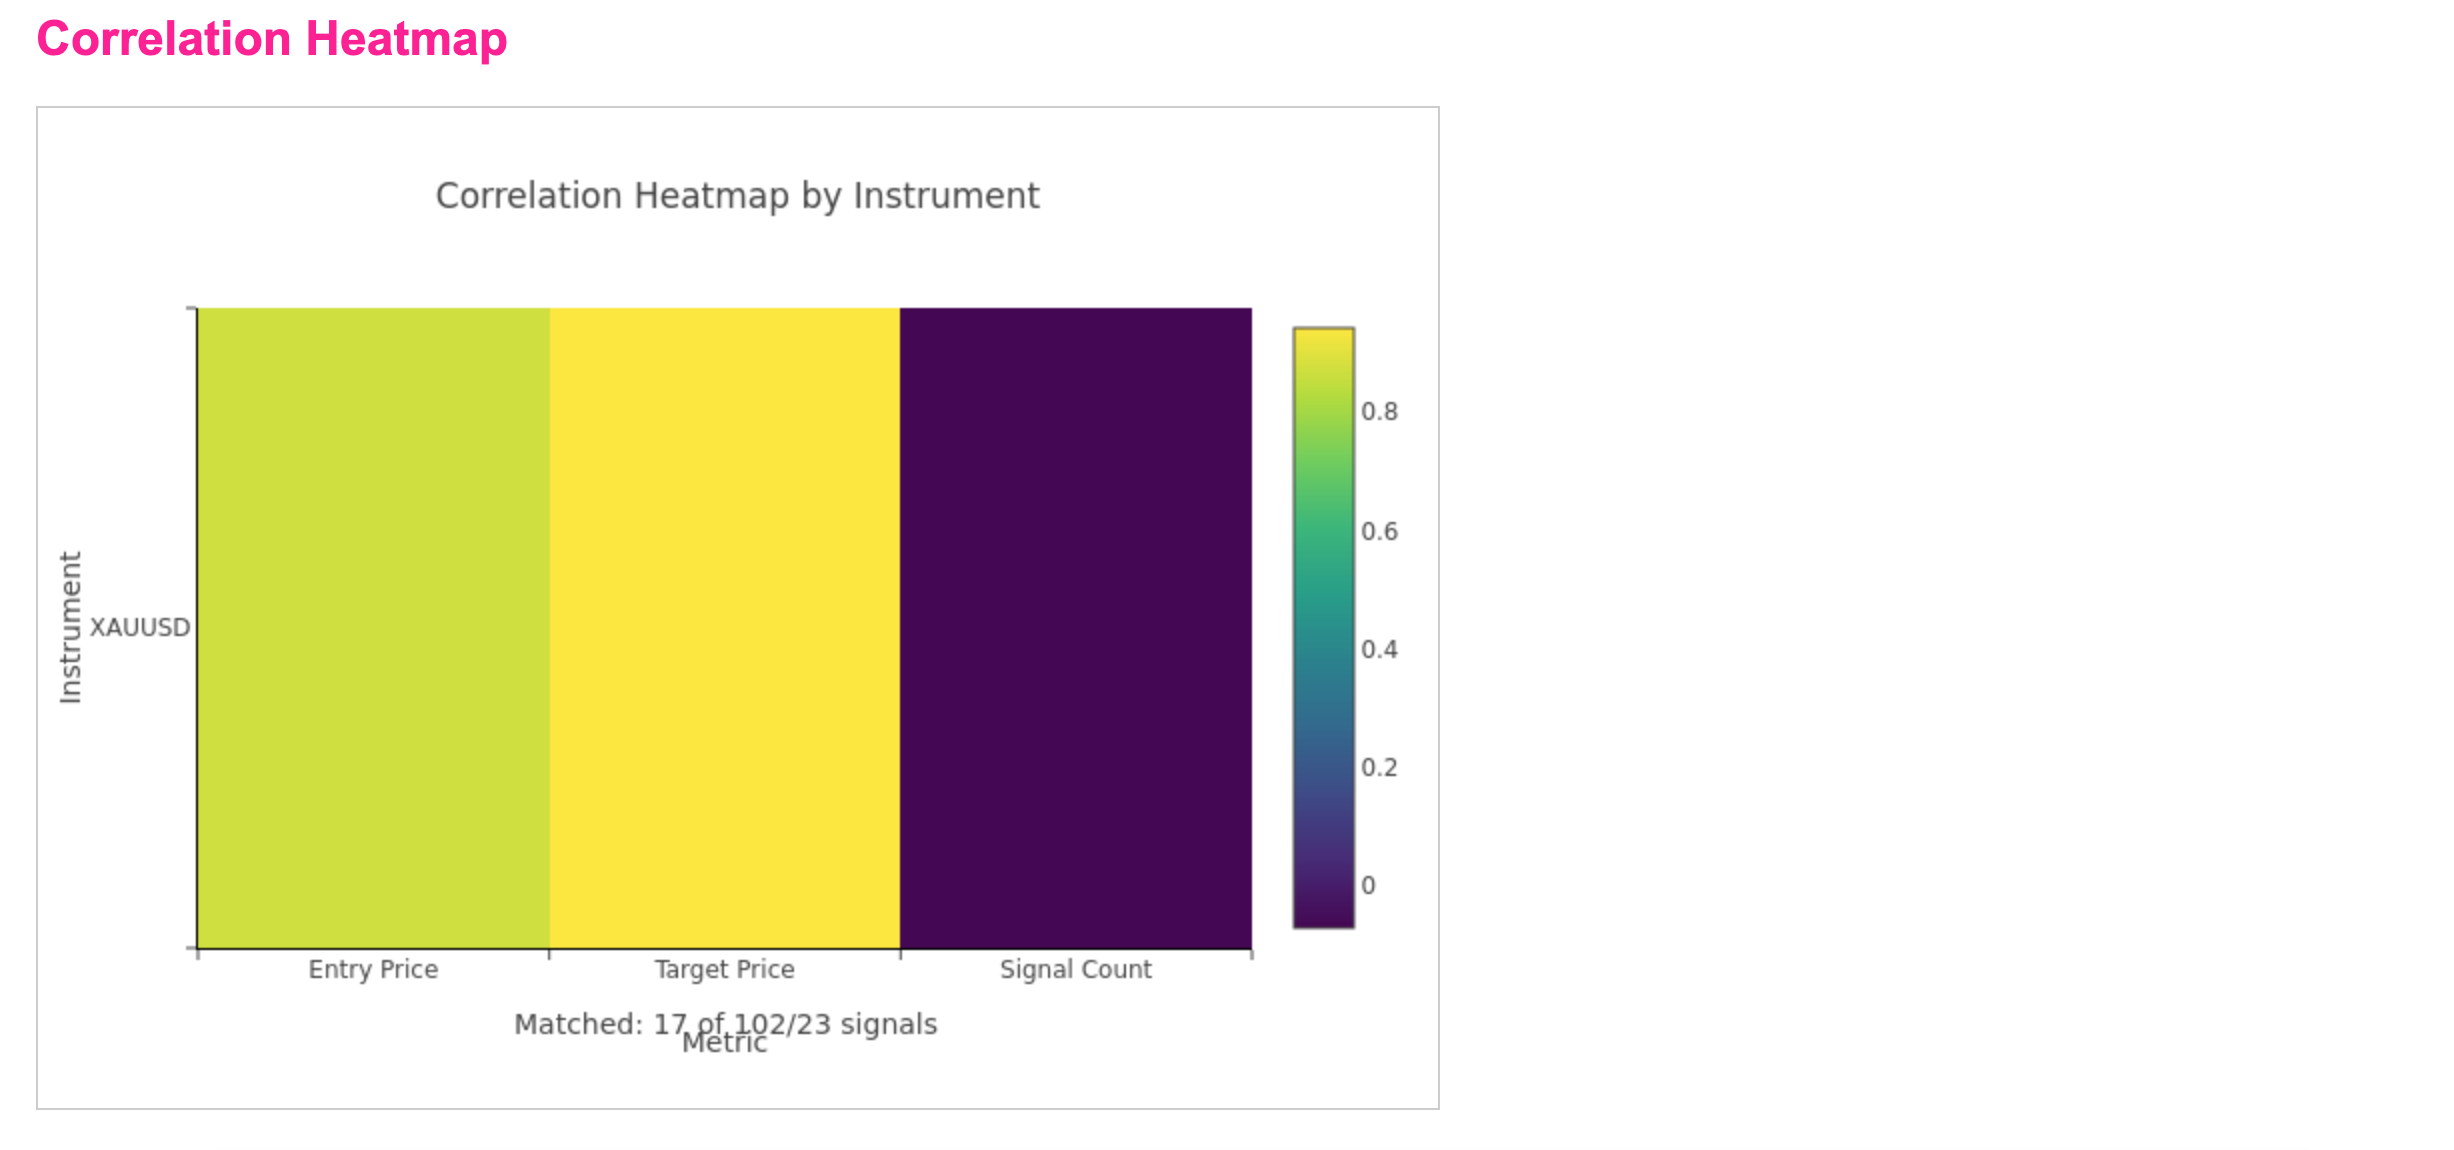
Matched Trades Summary
This shows:
-
The number of matched trades
-
Matches are determined by entry price and target price
Only trades that meet matching criteria are counted.
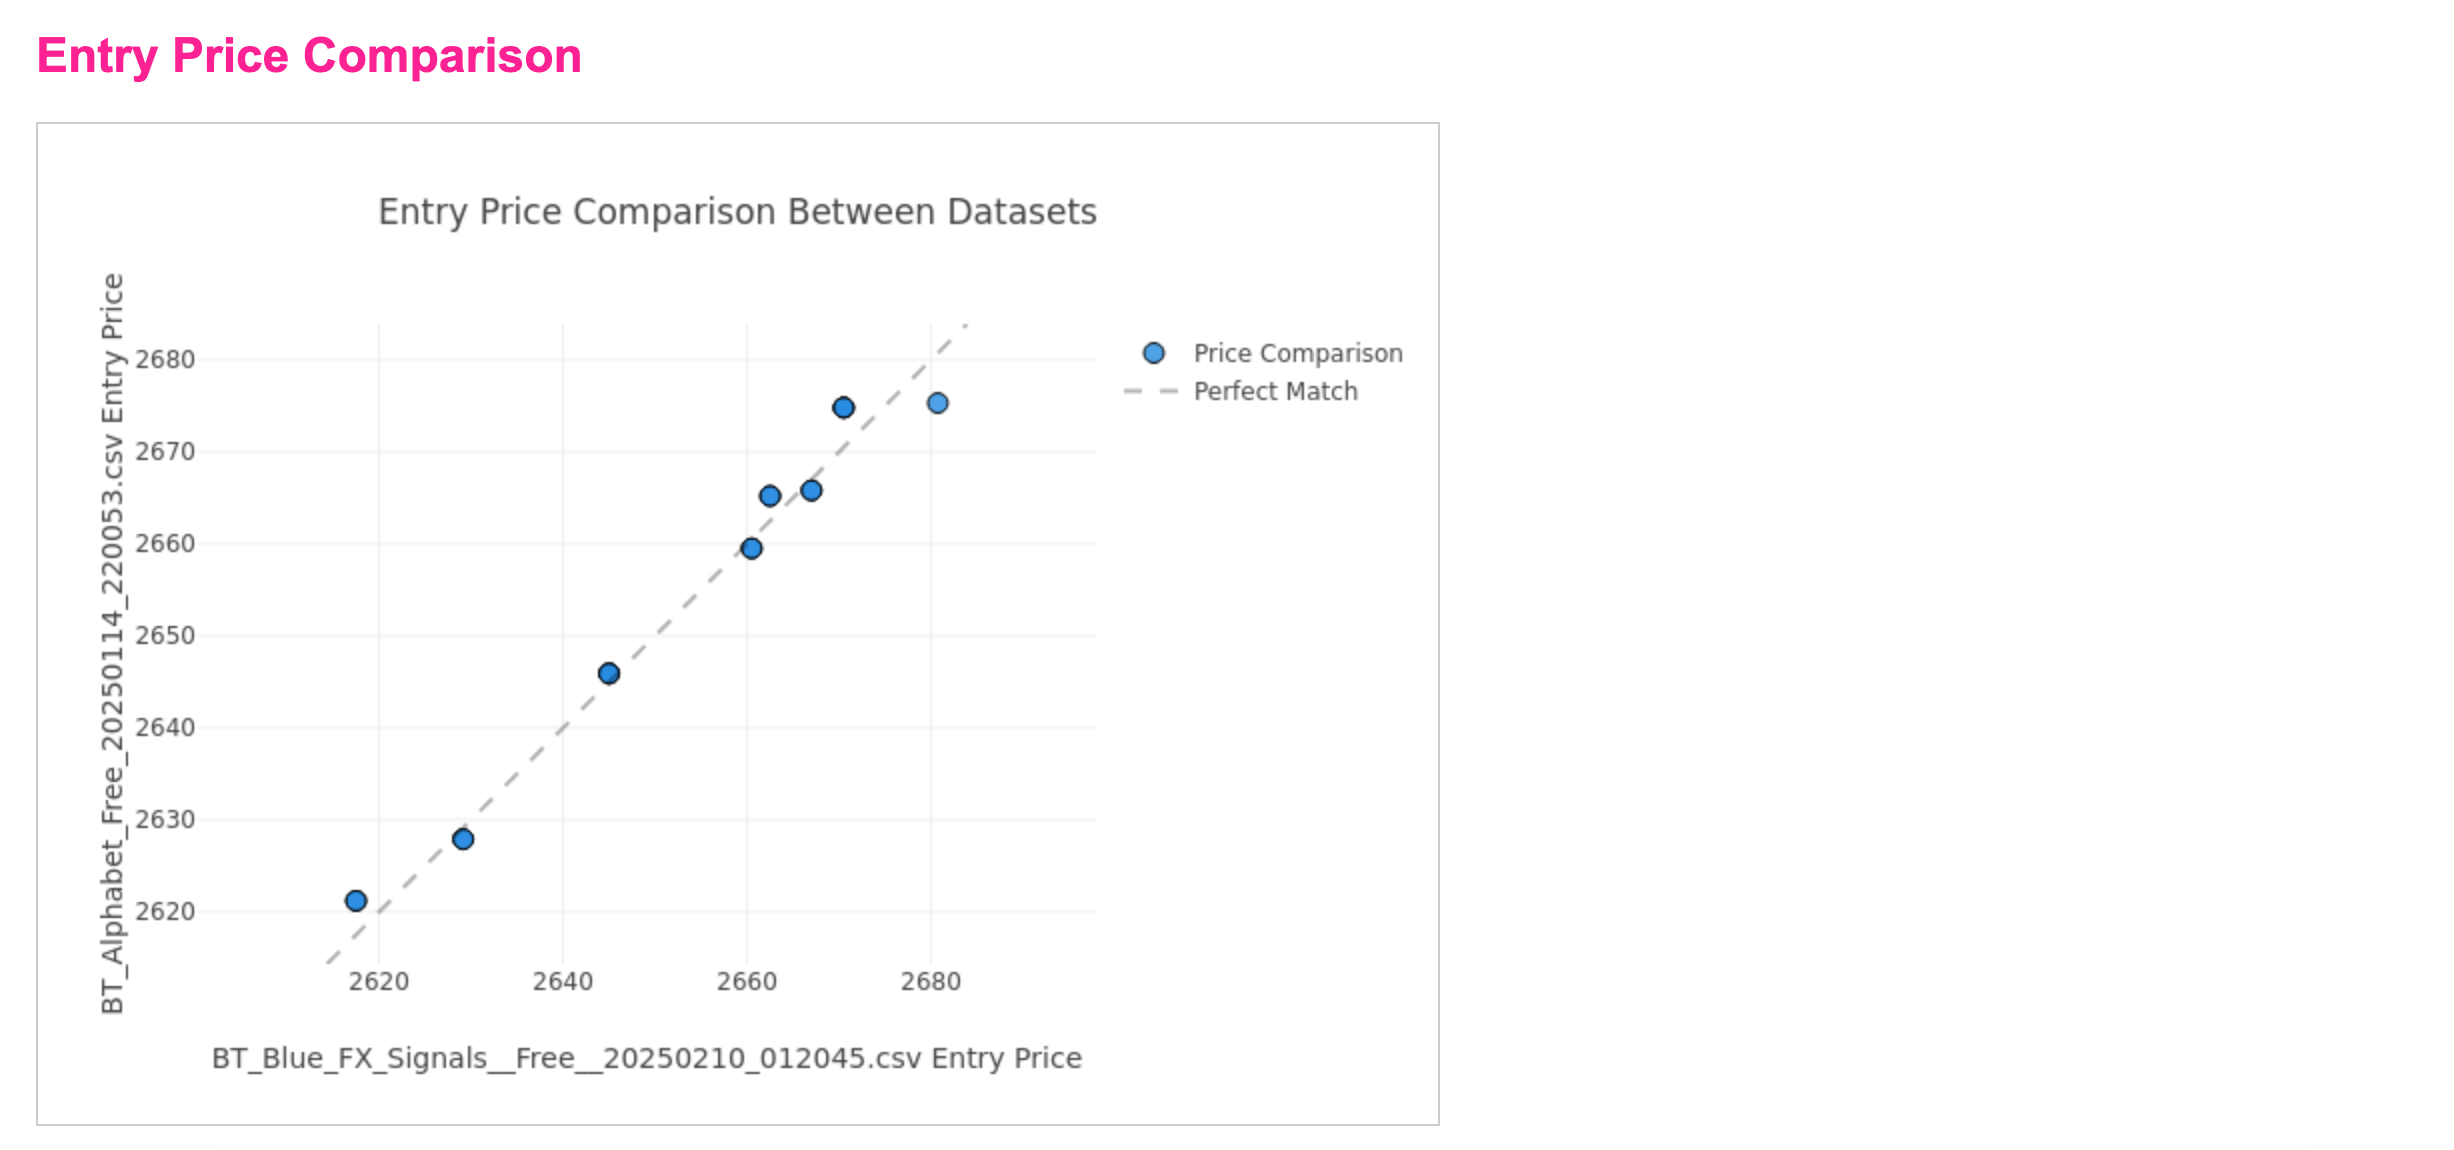
Entry Price Scatterplot
A scatterplot displays:
-
All matching entry prices
-
Visual clustering of overlapping trades
Tight clusters often indicate direct copying or near-simultaneous signals.
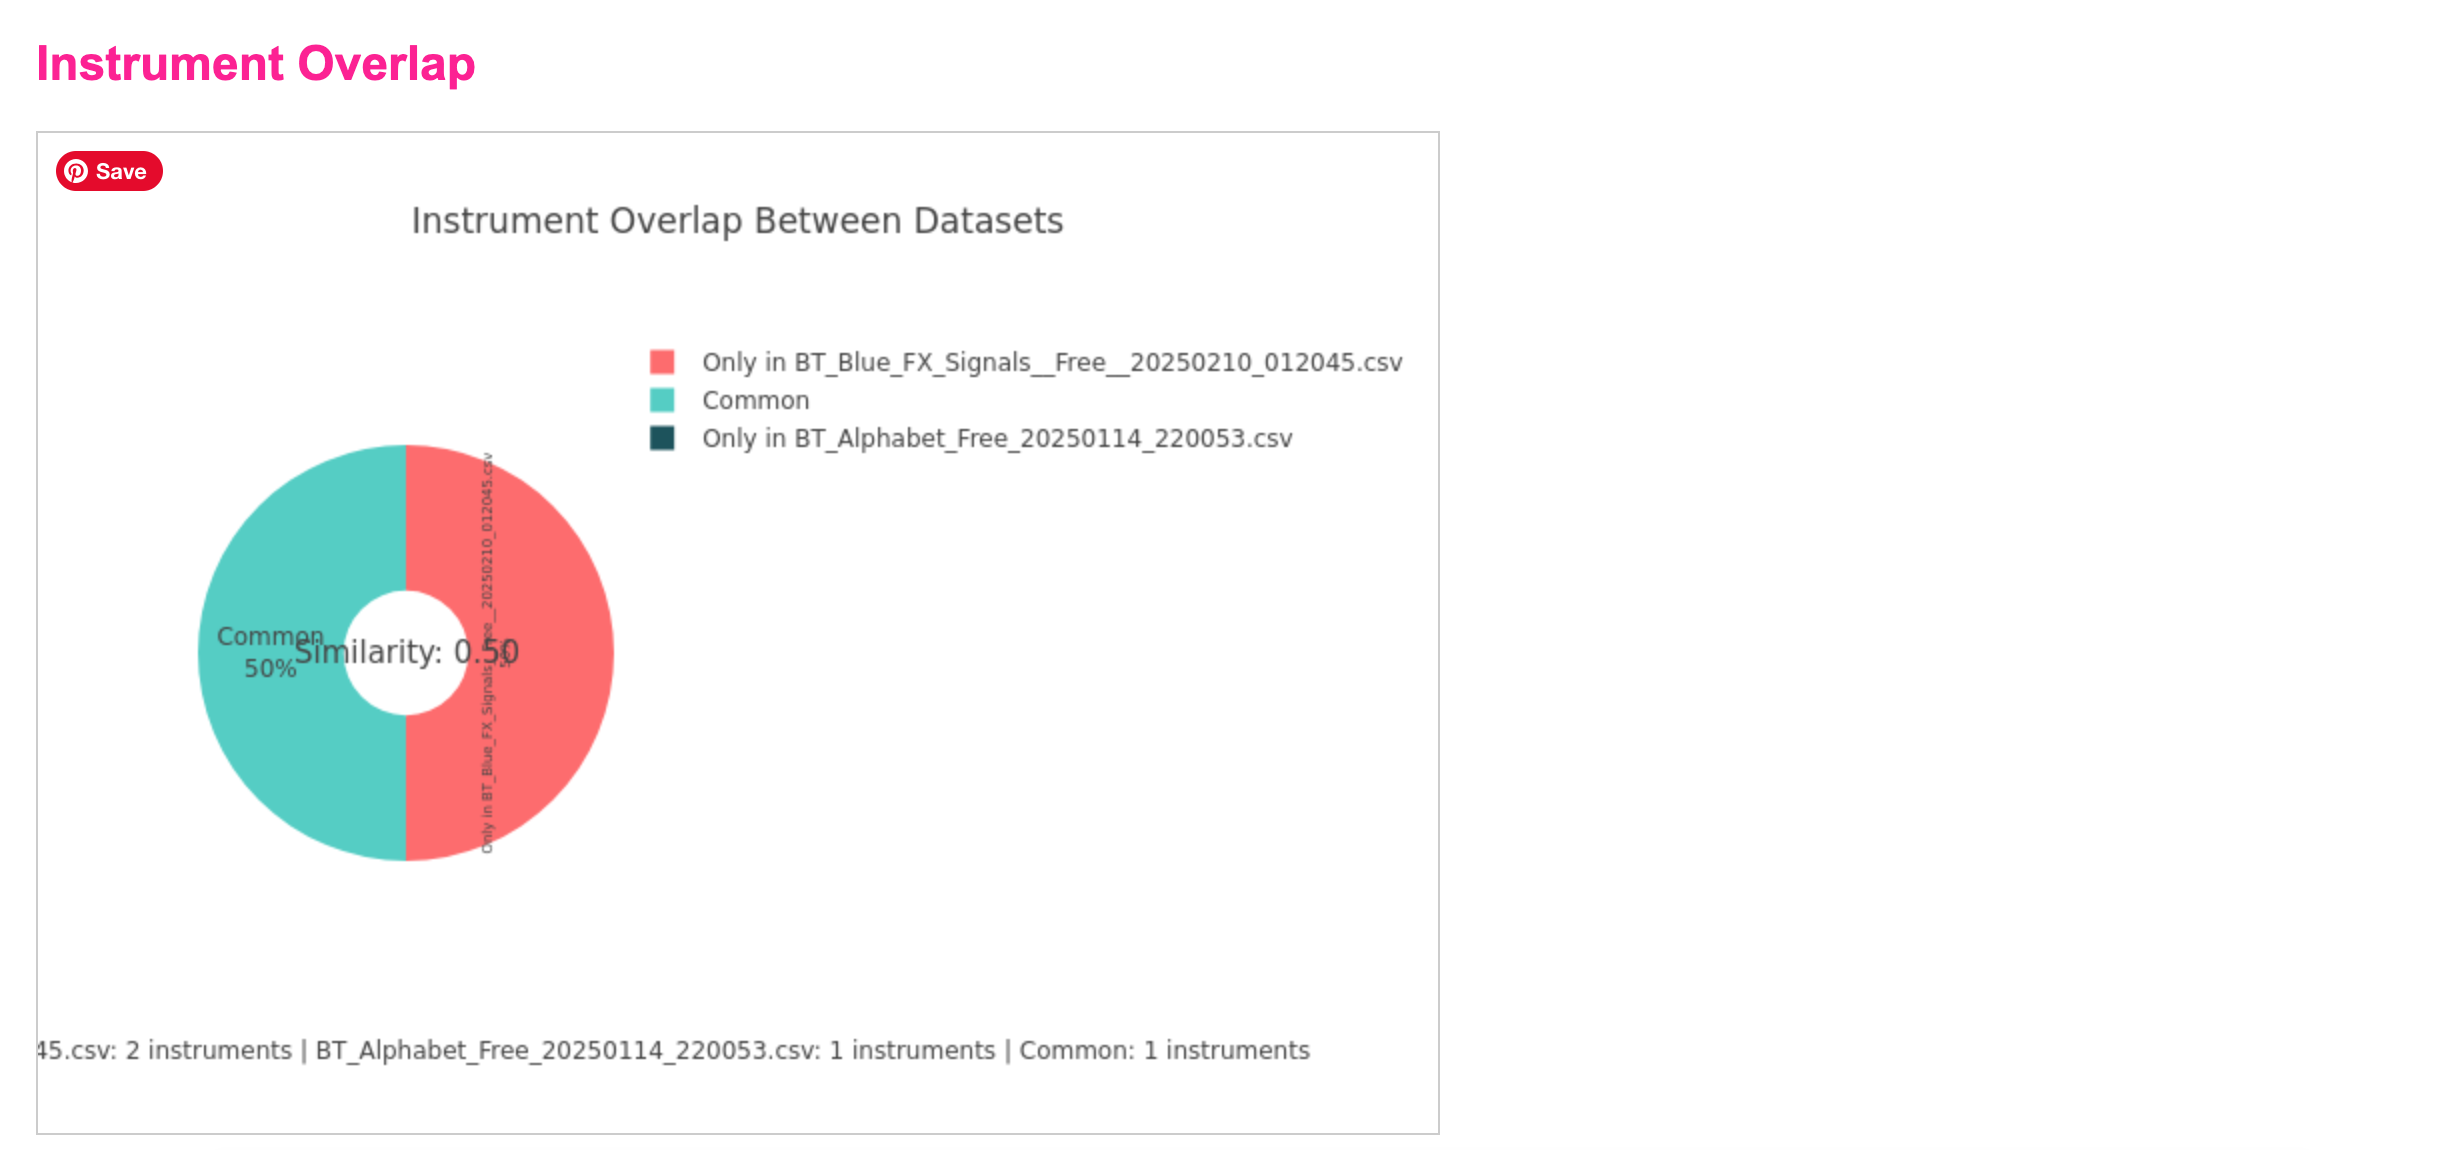
Instrument Overlap
This section shows:
-
Which symbols/instruments appear in both datasets
-
How concentrated the overlap is
High overlap across the same instruments can indicate shared signal sources.
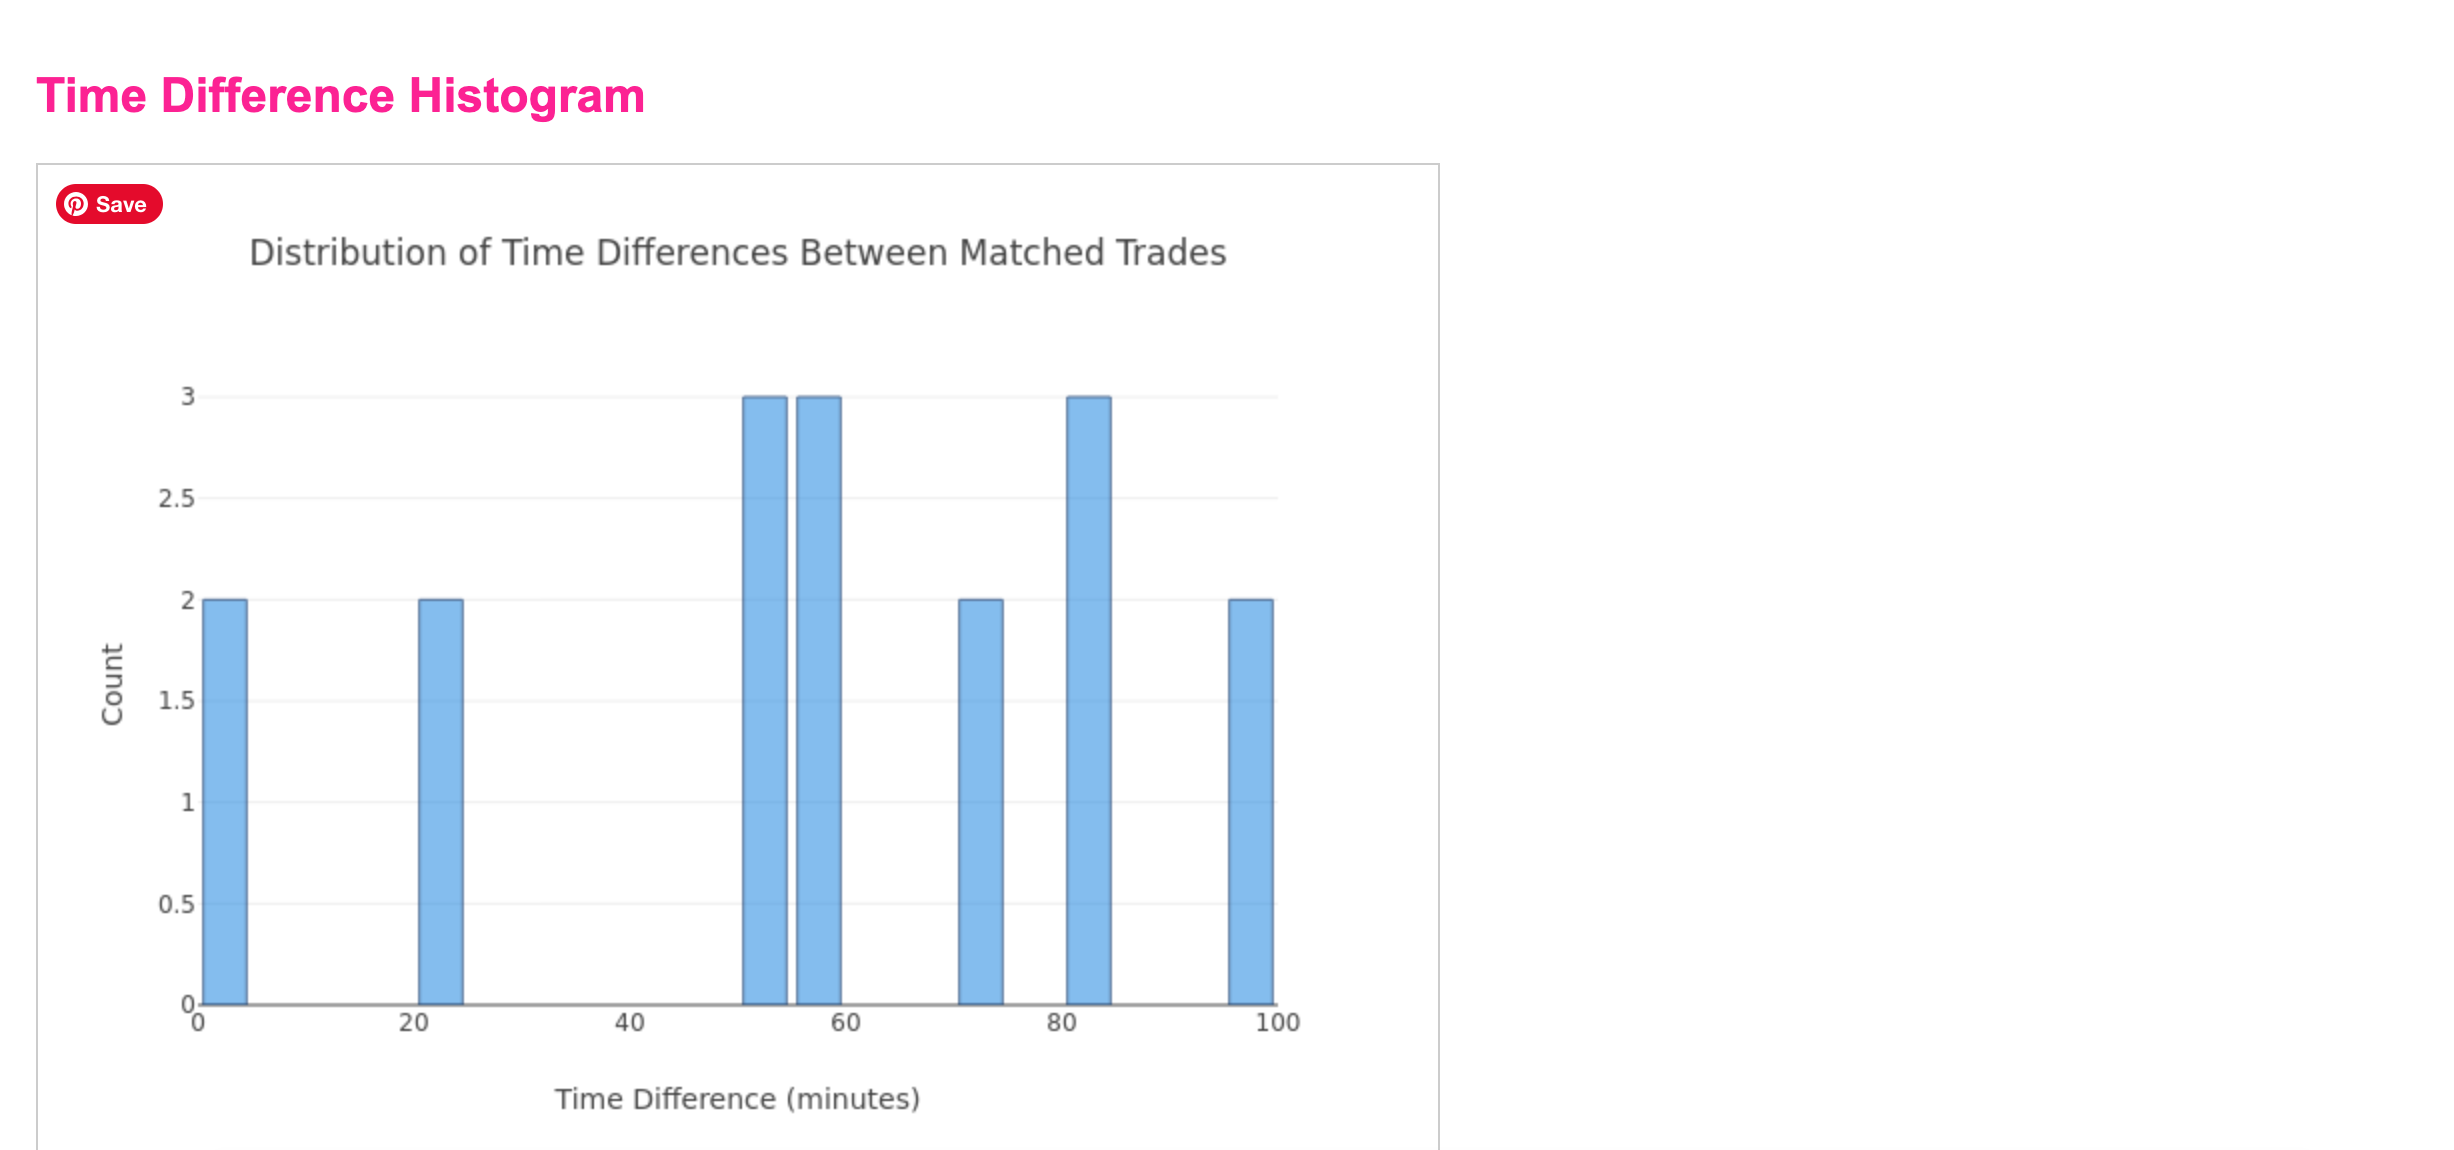
Time Delta Analysis
This shows:
-
The time difference between matching trades
-
How long after the original trade the second one appeared
You may see:
-
Trades grouped just minutes apart
-
Others delayed 20 minutes to 2+ hours
Consistent delays strongly suggest copying behavior.
How to Interpret the Results
-
Small time deltas → possible mirroring or automated forwarding
-
Large time deltas → manual copying or late signal delivery
-
High overlap + consistent delays → strong evidence of trade reuse
This is especially important for prop firm risk planning, where duplicated exposure can violate rules or increase drawdown risk.
Important Notes
-
Comparisons are read-only
-
No data is modified
-
Results are based on parsed trade data, not message text
-
Matching is price-based, not wording-based